- Banker's Edge
- Posts
- Deposit Run Postmortem
Deposit Run Postmortem
Which banks had to pay up to keep deposits and why it ultimately didn't matter
Brandon McCown
July 18, 2024
We’re a little over a year removed from the most recent crisis in banking. Worries over deposit runs have quelled and based on our conversations with clients during the most recent valuation cycle, the pressure on deposit pricing for the most part seems to be subsiding as well. Taking a postmortem look at the last twelve months ending March 31, 2024, presents some interesting findings.
As we had discussed this time last year, the deposit beta is a function of how quickly a bank’s deposit rates move in relation to how quickly the fed funds rate moves. In other words, a deposit beta of 1.00 means that for every 1.0% increase in the fed funds rate, depositors receive a 1.0% increase in their deposit rates. Therefore, the lower a bank’s deposit beta, the slower the bank is to pass on increasing interest rates to its depositors.
Using our database1 of all commercial community banks in the United States, we found that the average interest-bearing deposit beta from March 31, 2022 to March 31, 2023 was 0.22, during which time the fed funds rate rose 445 basis points. Comparatively, from March 31, 2023 to March 31, 2024 the average interest-bearing deposit beta for community banks was 1.80. Meaning that for every 1.0% increase in the fed funds rate, the average community bank’s cost of interest-bearing deposits increased by 1.8%. As illustrated in Figure 1, the fed funds rate only rose 68 basis points during the year ending March 31, 2024, while the average cost of interest-bearing deposits rose 122 basis points for community banks, which points to the well-known catalyst of March 2023.
The massive and highly public failure of Silicon Valley Bank woke up the sleeping populace to the reality that those NOW+ and MMDA’s that were earning less than 1.0% for the past 10 years were now worth something in the range of 3.0-5.0% to another bank that needed the liquidity. The external catalyst of a mini bank run ruptured everyone’s ALCO models for 2023. Let’s take a look at our database of community banks and observe how their balance sheets were situated on March 31, 2023 to better understand the impact of the liquidity crisis catalyst.
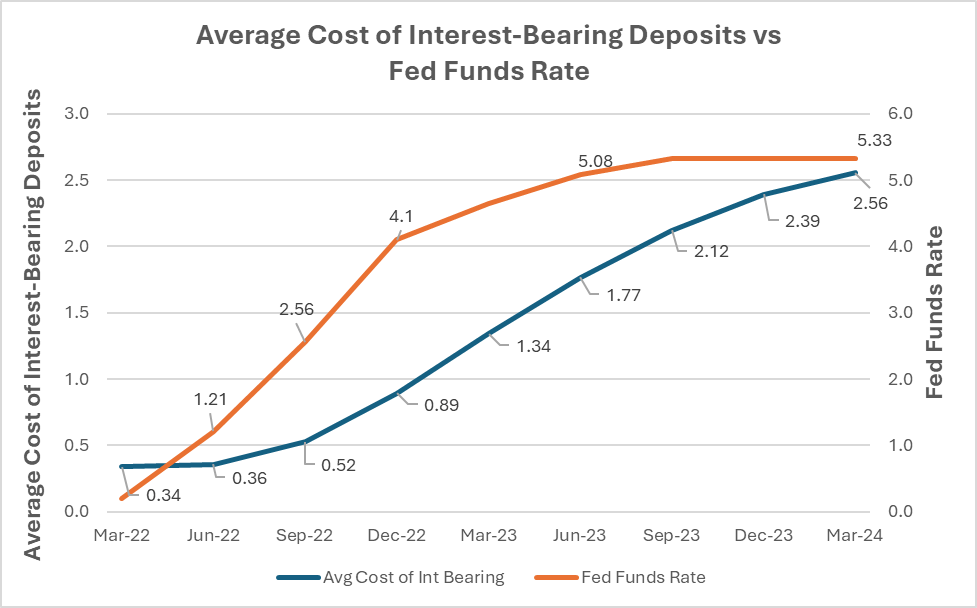
Figure 1: Chart mapping the increase in the fed funds rate from March 2022 to March 2024 compared with the average cost of interest-bearing deposits for community banks
Who Were the Winners/Losers in the Deposit Rate War?
Interestingly, having a higher percentage of noninterest bearing deposits in relation to total deposits as of March 31, 2023 was significantly related to a higher increase in the cost of interest-bearing deposits during the last twelve months ending March 31, 2024 (“LTM Mar 24”). One potential reason for this is that these banks were more willing to concede rates in their interest-bearing accounts to customers knowing that the net effect on their total funding cost would be more favorable than losing/repricing the entire deposit relationship.
Unsurprisingly, banks with higher levels of time deposits (both retail and jumbo) in relation to total deposits as of March 31, 2023 saw their cost of interest-bearing deposits increase the most during the LTM Mar 24. These banks saw increased pressure from super-regionals and other midsize banks offering compelling CD rate specials to maintain their current deposit base and attract new depositors. Finally, a bank’s level of total assets had a weaker but still significant relationship to how much the bank’s cost of interest-bearing deposits rose. Banks with higher total assets were generally located in more suburban or urban areas and likely faced an increased level of competition from mid-size and super-regional banks on their interest-bearing deposit rates.
Luck or Strategy?
How quickly and how drastically a bank’s cost of interest-bearing deposits rose wasn’t a function of luck, such as where the bank is located. Rather, the data bears out that despite the market in which a bank competes, the deposit mix was the primary determinant of how much increase a bank realized on its cost of interest-bearing deposits. And this is within the bank's control as management chooses whether to offer/promote certain deposit products.
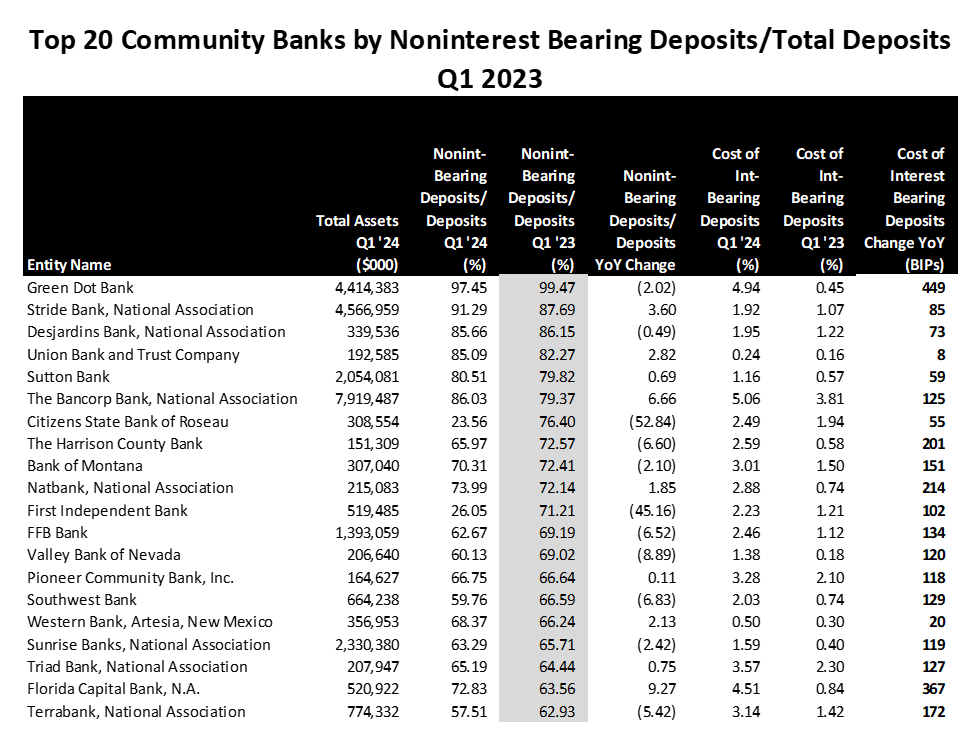
Figure 2: Top 20 commercial community banks ranked by ratio of noninterest bearing deposits-to-total deposits as of March 31, 2023

Figure 3: Top 20 commercial community banks ranked by ratio of total time deposits-to-total deposits as of March 31, 2023
Did it Really Matter How Much Your Deposit Pricing Increased?
Despite all the concern around deposit pricing over the previous year, one question we were interested in answering was, “How much of an impact did the rising cost of interest-bearing deposits LTM Mar 24 have on earnings compared to other income/expense segments?” We learned from our analysis that the degree to which a bank’s cost of interest-bearing deposits rose during the LTM Mar 24 had a small impact on the bank’s LTM Mar 24 return on average assets (“ROAA”). Furthermore, the level of overhead in relation to average assets had no significant relationship to LTM Mar 24 ROAA. Management teams’ focus on pinching pennies would be better off taking heed to what really moved the needle, which was the degree to which the yield on earning assets improved.
Yes, repricing assets proved to be the strongest factor in determining which banks had a good or bad last twelve months. In an elevated interest rate environment (which didn’t move dramatically relative to the previous twelve months) it makes intuitive sense that assuming a material increase in interest paid on interest bearing deposits for almost all banks, the repricing on earning assets would serve as the primary driver of performance. Unfortunately for some banks, the payment for past sins of having gone long in duration on securities during 2020 and 2021 combined with capital constraints have made it extremely challenging for them to restructure their balance sheet. For banks not in that position but still failing to meaningfully improve their yields, we can only assume that there’s a mismatch in the timing of their loans maturing (that will soon be resolved), or worse, a cultural problem with loan pricing.
The data points to the latter, a cultural problem with loan pricing. As shown in Figure 4 below which presents the 30 commercial community banks with the lowest yield on earning assets during the quarter ending March 31, 2023, 23 of the 30 banks had a year-over-year change in their yield on earning assets that was lower than the national average of a 74-basis point increase in the yield. This means that banks that already struggled with pricing, continue to struggle to keep up. As many bankers will attest to, this is not a simple fix. It will likely require hard discussions and decisions with lenders that have been with the bank for years and it will almost certainly require the CEO to lose favor with lenders. But bank CEOs who have managed to change their pricing culture can attest to the fruits that the labor produces, not just for the shareholders but for the bank as a whole.

Figure 4: Top 30 commercial community banks ranked by the lowest yield on earning assets during the first quarter of 2023
1 The database is a proprietary list of all active commercial community banks in the United States while bank specific data is provided by S&P Global Market Intelligence, 55 Water Street, New York, NY 10041.