- Banker's Edge
- Posts
- Credit Unions in Community Bank M&A
Credit Unions in Community Bank M&A
And the Looming Sub Debt Reset That's Not Getting Enough Attention
Brandon McCown
July 22, 2025
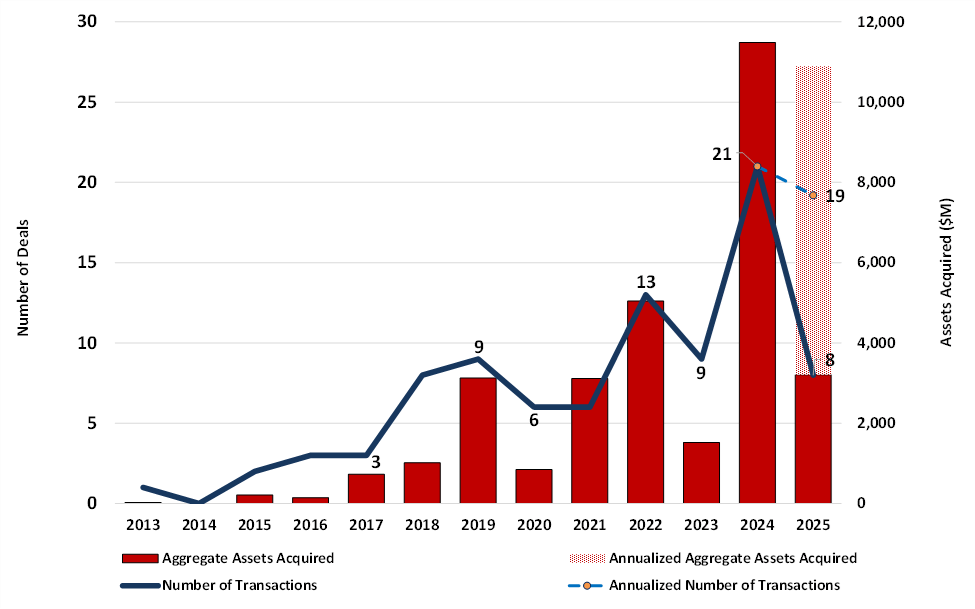
Transactions by credit unions purchasing community banks are increasing and reached an unprecedented scale during 2024. Last year there were 21 transactions where a credit union purchased a bank for aggregate assets acquired of $11.5 billion. Comparatively, in our database of transactions involving community banks, the $11.5 billion in assets acquired are 130% higher than the next highest year (2022) in which $5.0 billion were acquired over 13 transactions. While it’s reasonable to assume there were one or two transactions in 2024 that tipped the scales, that would not align with the data as only two transactions were for banks with assets greater than $1 billion and both accounted for less than 15% of the $11.5 billion total.
And looking at the graph below, 2025 shows minimal signs of reversing the trend. As of May 2025, eight transactions have been announced in which a CU is acquiring a bank, which would be on pace for 19 total transactions with total assets acquired of $7.7 billion. Given how many banks are hamstrung by large negative AOCI balances of their own, it’s understandable that bank acquirers don’t have quite the risk appetite to assume the losses of another bank’s portfolio and compete with untaxed entities in the M&A market. Simply put, it’s an unfair playing field. This challenge, however, plays out differently across varying states.
Data source: The Bank Advisory Group
Since the beginning of 2023, credit union acquisitions of banking entities have been most concentrated in four states based on the target’s domicile: Washington (6 deals), Illinois (5), Arizona (4), and Florida (4). Notably, Washington’s transactions were all executed by in-state credit unions, while most Illinois deals involved acquirers headquartered in Michigan. As illustrated in the following heat map, these four states alone account for over half of all credit union-bank acquisitions announced during this period.
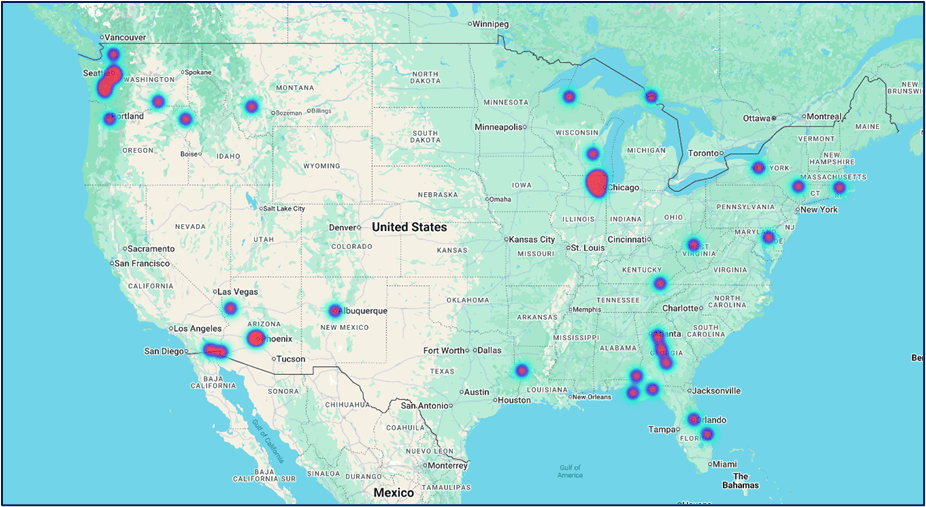
Heat map depicting credit union acquisitions of community banks
While the absolute number of credit union acquisitions is rising, the activity remains focused in states where such deals are more permissible—legally and culturally. This is consistent with broader patterns: Michigan, Washington, Arizona, and Illinois have all been characterized by favorable environments for credit union expansion. For community bank leaders operating in these regions, this trend reinforces the need to understand the evolving competitive dynamics posed by tax-exempt institutions increasingly acting—and competing—like regional banks.
Strategically, these acquisitions often provide credit unions with experienced commercial lenders and immediate market presence—an efficient alternative to organic growth. These workforce acquisitions underscore a long-standing concern among bank executives: Why are entities that increasingly mirror commercial banks in structure and function still benefiting from a preferential tax framework?
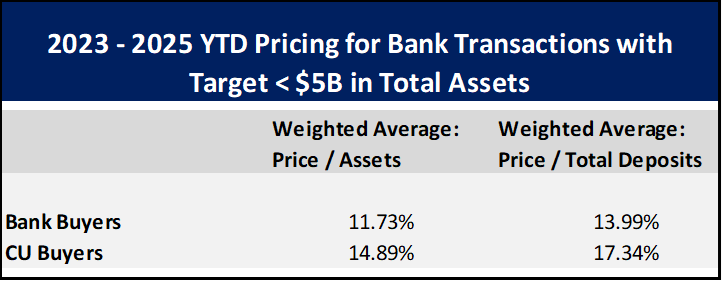
However, for bank shareholders contemplating a near-term exit, credit unions may present more of an opportunity than a threat. As shown in the accompanying chart, credit unions have, on average, offered roughly 300 basis points more in purchase price (as a percentage of assets) than traditional bank acquirers. Even when a transaction ultimately closes with another bank, the mere presence of a credit union bid can serve as valuable leverage to enhance pricing and terms.
Data source: The Bank Advisory Group
For banks looking to remain independent in states where credit union legislation and public opinion is generous, lobbying could be a formidable strategy. And perhaps as interest rates decline and bond portfolios heal, there will be a return to more normative risk appetites amongst acquirers. However, given the increasing technological and managerial hurdles that bank management teams must overcome, how long can they compete on a tilted playing field with one arm already tied behind their proverbial back?
Looming Sub Debt Issuances to Reprice
Roughly $11.35 billion in fixed-to-floating subordinated debt issued by U.S. banks will reset this year, according to S&P Capital IQ. Most of these notes were structured in 2020 with 5-year no-call periods when the Secured Overnight Financing Rate (the “SOFR”) was near zero. As of this writing, the 90-day average SOFR sits at 4.34%.
The implications are twofold:
(1) A roughly 400 basis point increase in interest expense will flow through the income statement, applying pressure just as banks begin to see margin stabilization.
(2) As these notes begin to amortize, their Tier 2 capital treatment gradually declines, tightening capital flexibility.
Management teams are confronting these dual headwinds while still navigating sizable unrealized losses in securities portfolios and limited visibility into the rate path. The timing is not ideal.
Some issuers have responded proactively:
Refinancing into fixed-rate debt to gain planning certainty
Paying off callable notes outright
Monetizing non-core fixed assets via sale-leasebacks to retire obligations
The right path depends on each bank’s capital stack, cost of funds, and balance sheet duration. But across the board, reducing structural uncertainty may prove more valuable than marginal cost savings in this environment.
As the market watches for rate cuts and credit normalization, this reset cycle will be a quiet but material swing factor in earnings for many institutions.